Data & Development | Philipp Kollenda
Motivation
Research
Presentations
Teaching
Blog
About
Categories
All
(4)
dataviz
(1)
football
(1)
how-to
(2)
interactive
(1)
neat-tricks
(1)
quarto
(1)
tidytuesday
(1)
Blog
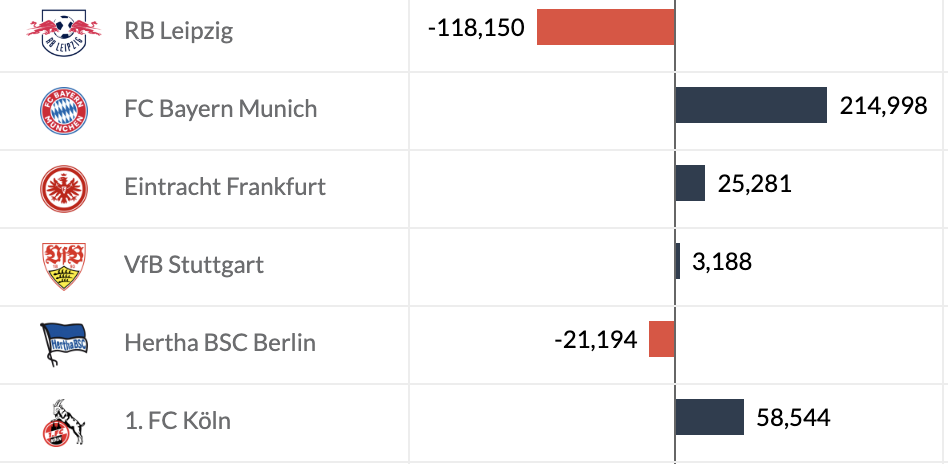
Excess attraction in the Bundesliga
Which teams would have the most members if location was the only thing that mattered?
interactive
football
In August 2022, Ansgar Wolsing shared a visualization that shows how many Germans live closest to each football club in the first and second division (here is the tweet).…
Aug 18, 2022
Philipp Kollenda
Alphabetically sorting your source code character vectors
Neat little tricks, Episode 1
neat-tricks
For week 33 of #TidyTuesday 2022 I had to manually select names from a dataset. So, I typed something like
Aug 17, 2022
Philipp Kollenda
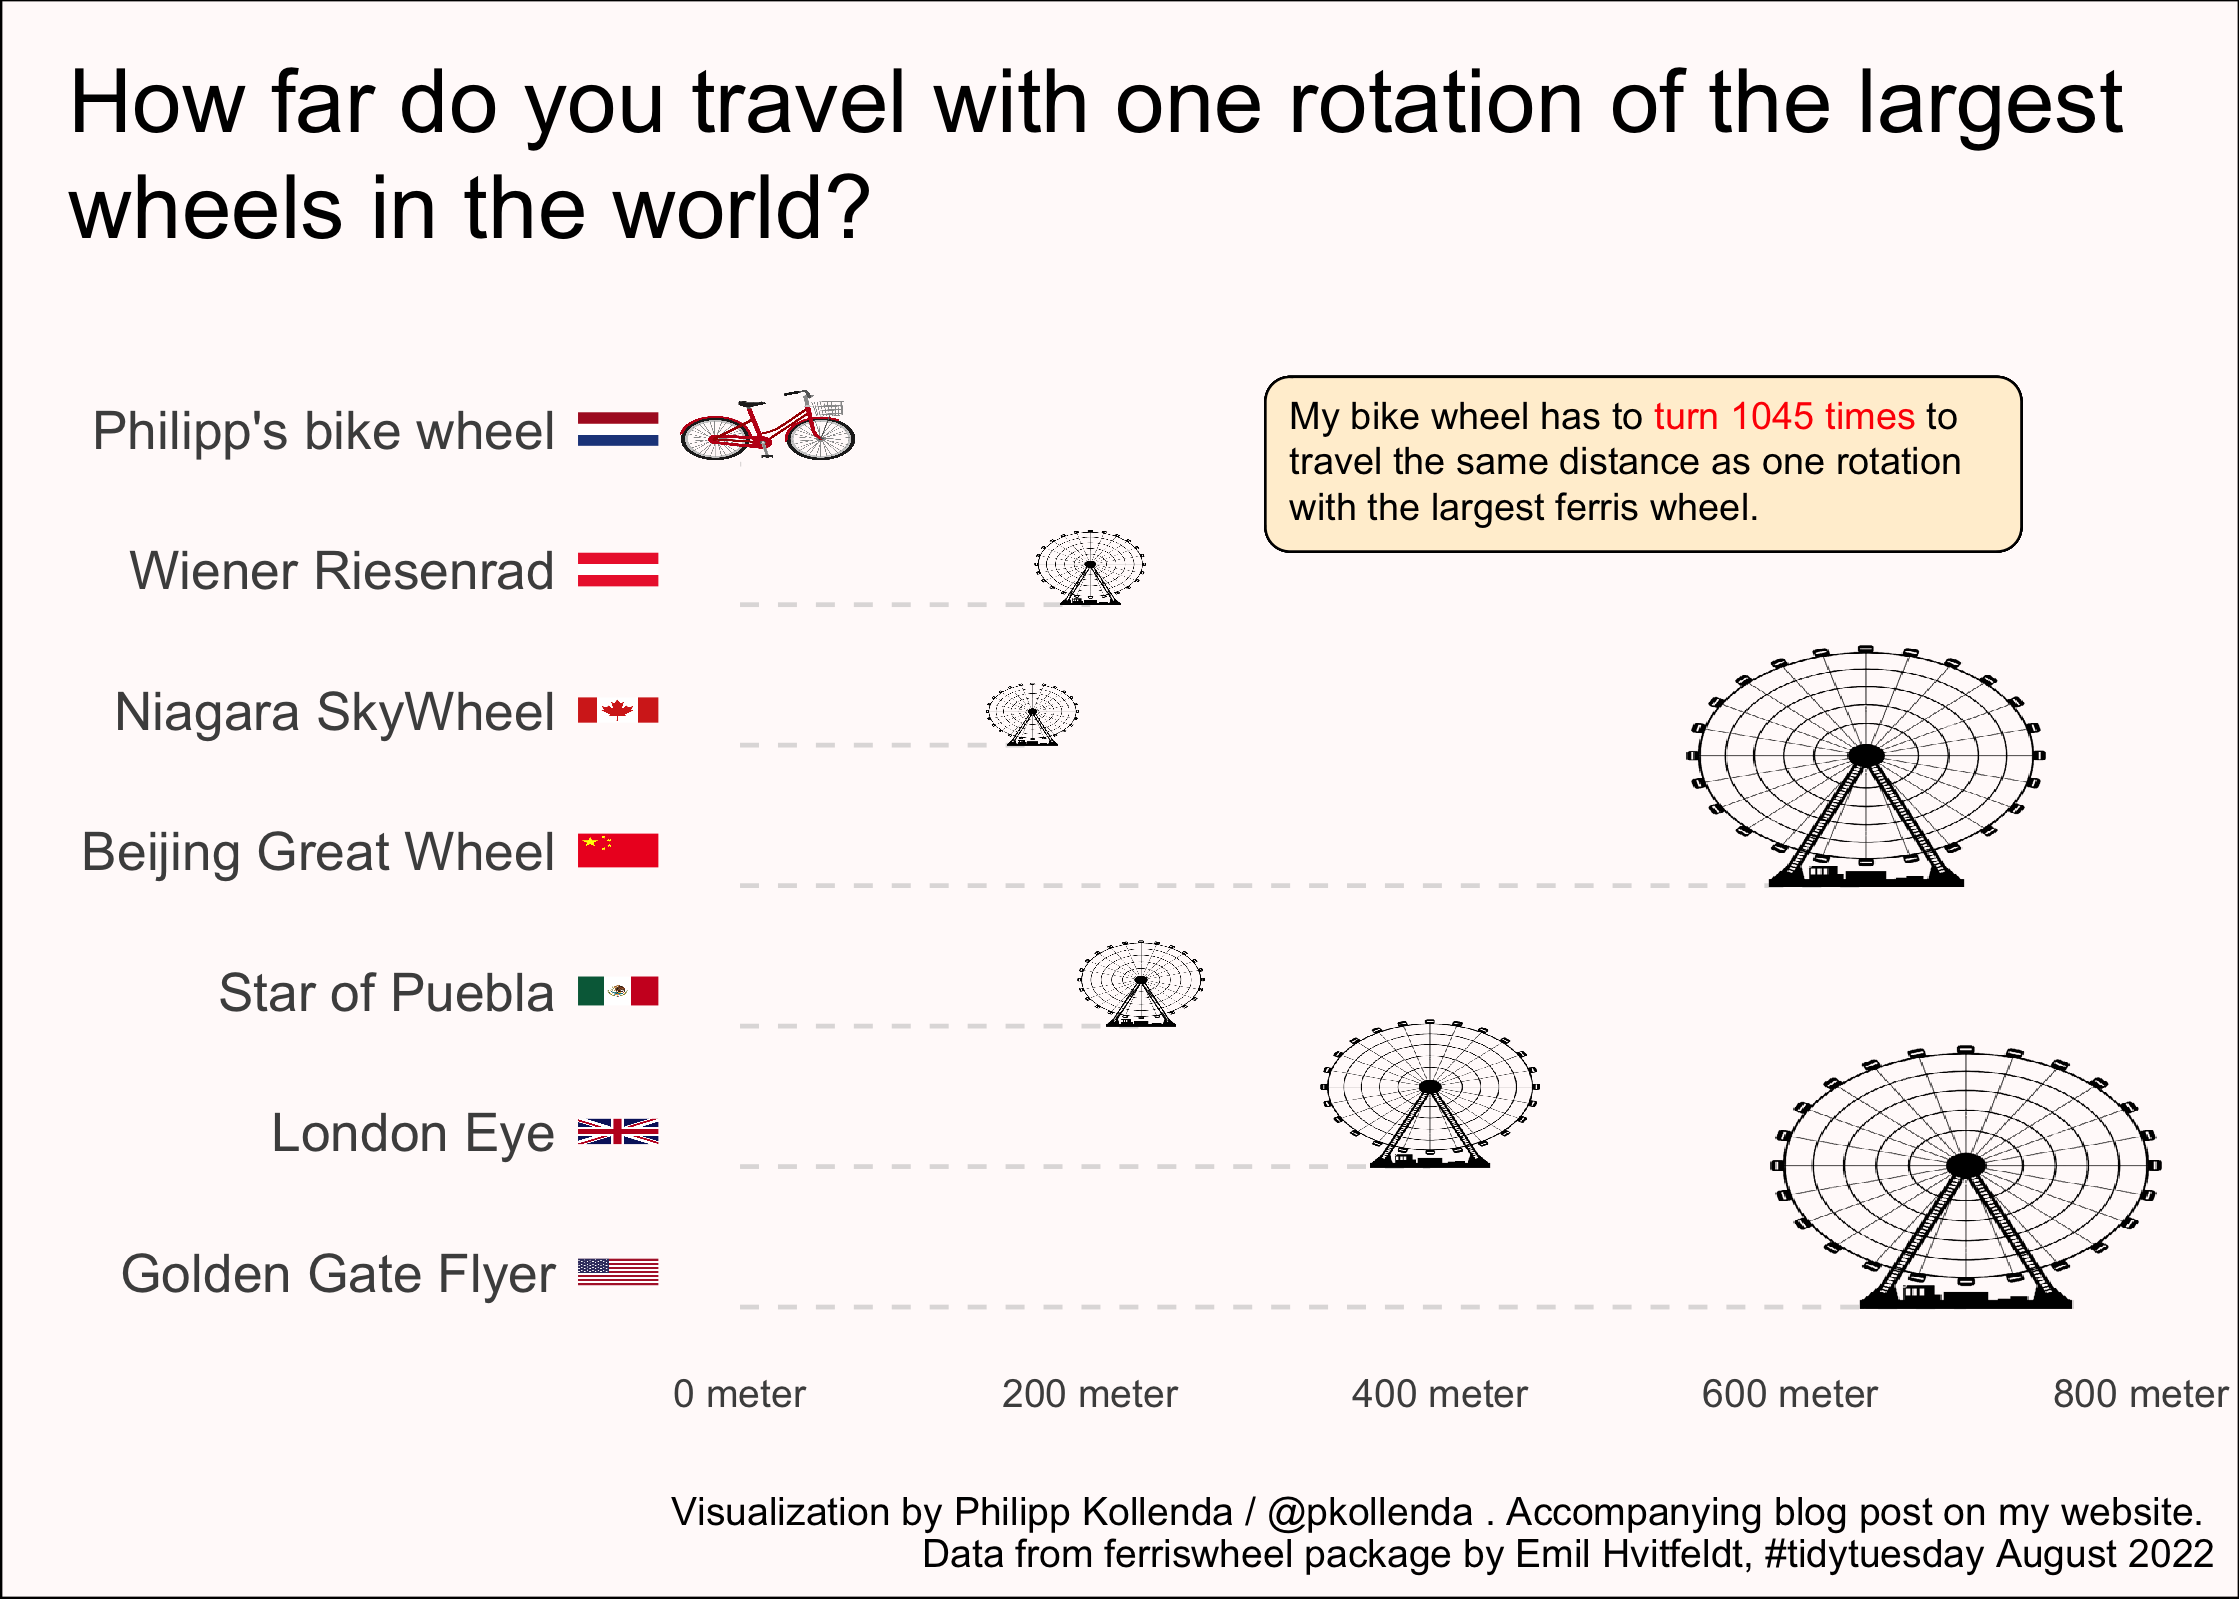
How far does that ferris wheel roll?
#tidytuesday data visualization with R, ggplot and ggimage
tidytuesday
dataviz
how-to
What I love about data visualization is how it combines creative thinking (
what
do I want to show?) with technical programming skills (
how
do I show this?). Nowhere do you…
Aug 9, 2022
Philipp Kollenda
Build a simple website with R and Quarto in under
30
10 minutes.
And then spend hours tweaking it.
quarto
how-to
A week has past since rstudio::conf 2022 and my excitment about Quarto, a new multi-output, language agnostic publishing system has only grown with every new amazing resource…
Aug 6, 2022
Philipp Kollenda
No matching items